
Start With a Test Budget, Not a Number
Most small advertisers guess a monthly figure and hope. A better method starts with the cost of one result, not the total. If a click costs about $0.80 and you want 300 clicks a week, your floor is roughly $240 a week. That math keeps you honest before you touch a single campaign setting. These figures are examples; swap in your own averages before you set a cap.
Give every new campaign a two-week test window and a cap of $10 to $20 a day. You need about 50 results per ad set before the numbers mean anything; below that you are reading noise. Plan the test budget first, then the scale budget. Landing pages matter as much as ads here, so see our SEO guides for the page side.
Know Your Three Core Metrics
Three numbers decide everything: cost per thousand impressions, cost per result, and return on ad spend. Track them weekly, not daily, because day-to-day swings on small budgets are mostly random. A $500 campaign can swing 40 percent between Tuesday and Thursday with no real change in quality.
Set a target before you spend. If your product sells for $50 and costs $20 to make, your break-even return on ad spend is about 1.7. Write that number down and compare every ad set against it. Anything far below it gets paused, not optimized. Review the target every quarter, since material costs and prices move.
Allocate by Funnel Stage
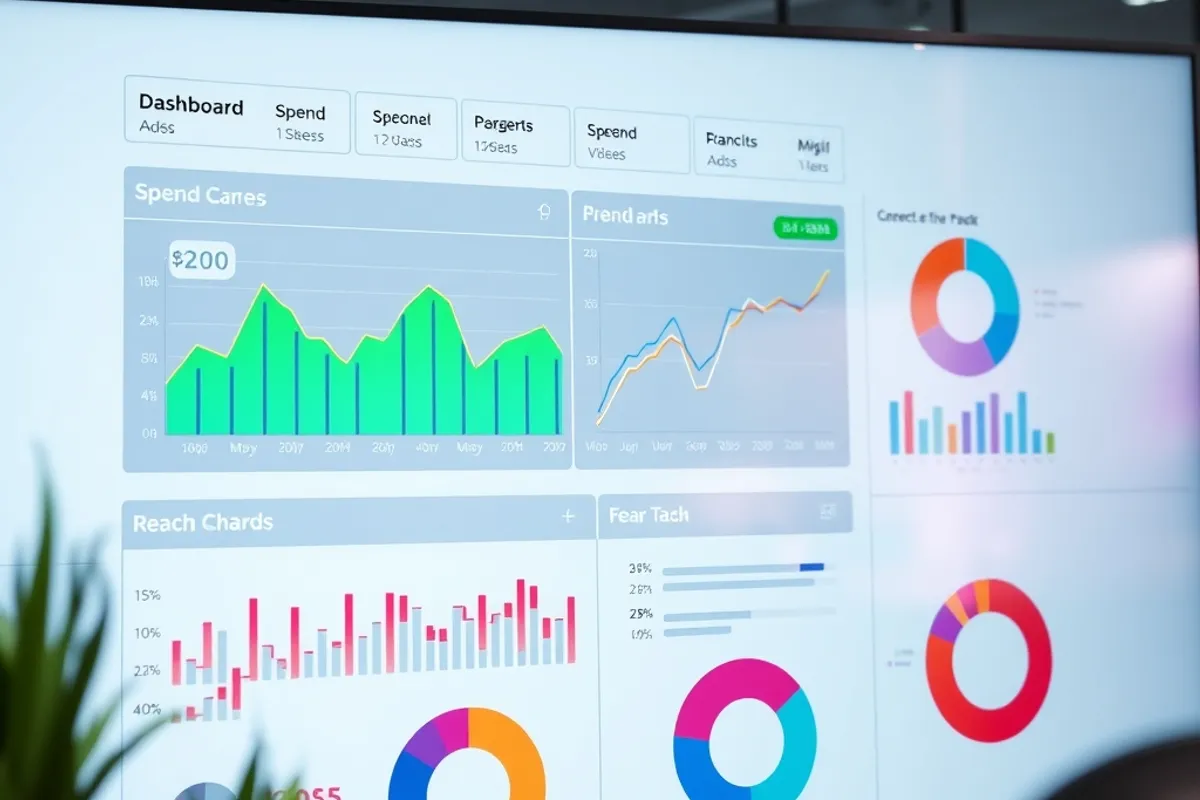
Split your budget across three stages: reach, consideration, and conversion. A common starting mix is 20 percent for awareness, 30 percent for engagement or traffic, and 50 percent for sales. Adjust once you know which stage starves the others. New brands usually need more reach; established brands usually need more conversion.
Do not let one stage eat the whole budget because it reports cheap clicks. Cheap traffic that never buys is the most expensive traffic you can run. Tie each stage to its own success metric so a low click price cannot hide a weak return. A short reporting rule keeps the mix honest as spend grows.

Start with the smallest daily budget that can gather data, then let cost per result, not gut feeling, decide where the next dollar goes.
Set Daily and Lifetime Caps
Daily caps protect you from a bad day; lifetime caps protect you from a bad month. Set the daily cap at roughly one-tenth of your monthly budget, then set a lifetime cap as a hard stop. If a campaign spikes overnight, the cap ends the bleed without you watching the dashboard at 2am.
Caps also smooth delivery. A $30 daily cap spreads spend across the day instead of dumping it into the first two hours. That steadier pace usually improves cost per result, because the platform has time to find cheaper placements. Set the cap just above your normal daily spend so it never throttles a good day.

Seasonality and When to Push
Ad costs rise in the fourth quarter and fall in January. If you sell gifts, shift 30 to 40 percent of your annual budget into October and November. If you sell business tools, January and September are your cheapest months to reach decision makers.
Watch your own data before you trust a general rule. Pull last year's cost per result by month and let your own history set the pattern. A seasonal table helps you plan ahead. Book your biggest pushes three weeks early, before auction prices climb.
| Month | Typical cost trend |
|---|---|
| January | Lowest |
| October | Rising |
| November | Highest |

Auditing Spend and Cutting Waste
Audit your account every two weeks. Look for ad sets that spent over $100 with no result, audiences that overlap, and placements that never convert. Cutting the bottom 10 percent of spend often frees enough budget to fund your best performer at double the pace.
Keep records of what you tested and what it cost. When you run ads, make sure your claims are truthful and your disclosures are clear; the FTC advertising guide for small business explains the rules in plain language. Good records also help at tax time. A shared spreadsheet is enough; keep it updated after every test.
A Simple Monthly Budget Template
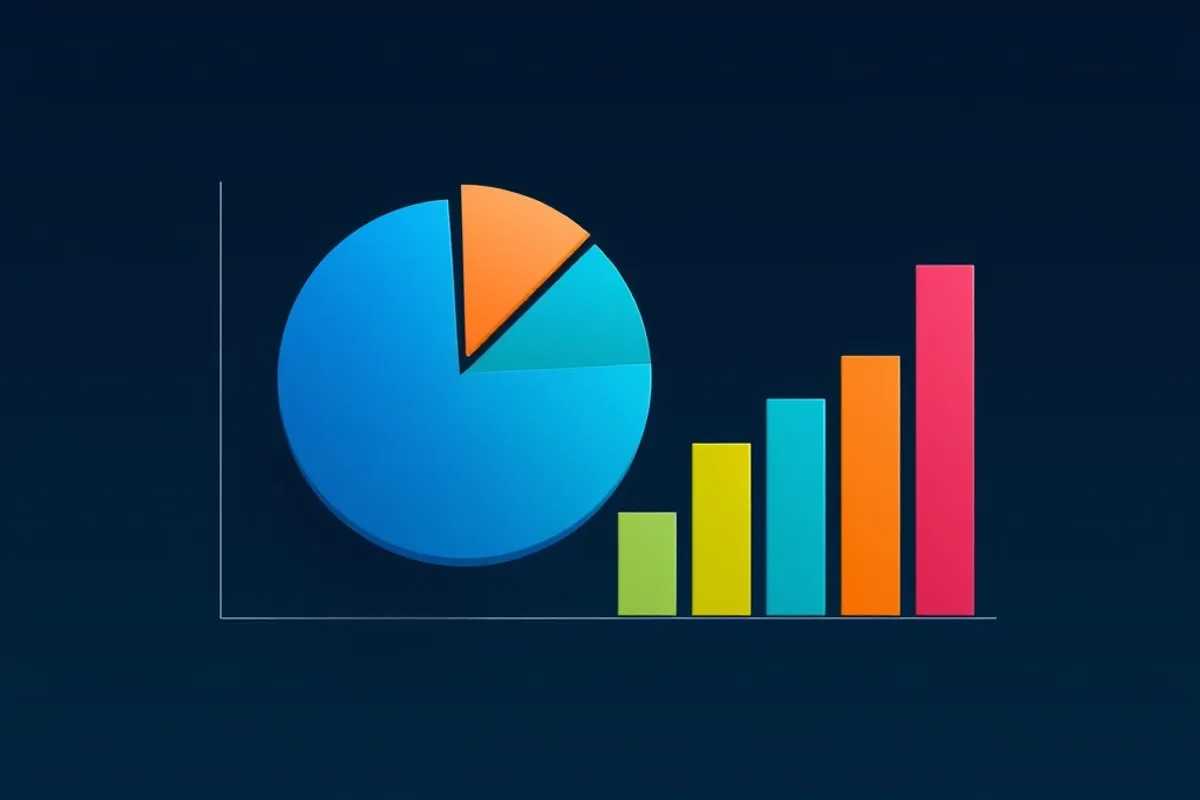
Use a fixed split: 50 percent proven campaigns, 30 percent scaling tests, and 20 percent new experiments. The proven group protects your return, the scaling group pushes what already works, and the experiment group finds next quarter's winner. Before you finalize it, read our internet marketing guides on tracking and attribution. Never let the experiment group grow larger than the proven group. Review the split at the end of each month and move points where results demand.
- Proven: 50 percent, target return on ad spend 2.0 or better.
- Scaling: 30 percent, target 1.5 or better.
- Experiments: 20 percent, judged on cost per result only.